The 2026 Australian Cloud Reality Check
As we kick off 2026, the industry is buzzing with the concept of "Sustainability by Design." With the release of the Q1 2026 Cloud Region Carbon Intensity Scorecard, we have fresh data on the environmental impact of our digital infrastructure.
While Europe continues to boast "A+" grades thanks to grids heavy in renewables, the story for Australian and the wider Asia Pacific region remains challenging. For Australian engineers and architects, the 2026 data presents a stark reality: despite our solar boom, our cloud regions are still heavily carbon-intensive.
Source: Greenpixie Cloud Region Carbon Intensity Scorecard (Jan 2026)
The Australian Carbon Landscape: A Sea of "E" and "F"
The latest data reveals a hard truth: Australian cloud regions rely on grids that still have high carbon intensity compared to global leaders.
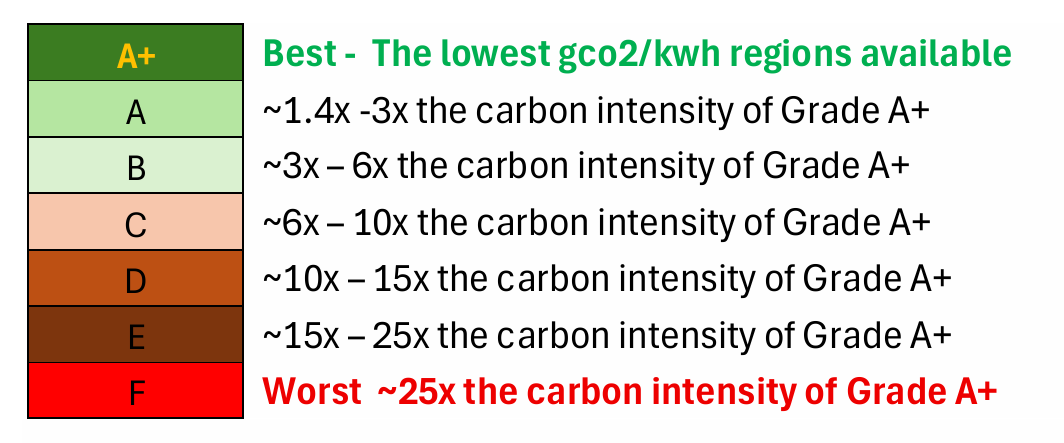
In the Greenpixie grading system, where A+ is the best and F is the worst (emitting ~25x more carbon than an A+ region), Australian regions consistently fall into the bottom tiers. This means your "Scope 2" emissions (indirect emissions from electricity generation) are significantly higher than your peers deploying in Canada or Scandinavia.
The Aussie Scorecard Snapshot (Q1 2026)
Here is a look at the current state of Australian regions across Amazon Web Services, Microsoft Azure, and Google Cloud (GCP). The grades are concerning for any organisation with Net Zero targets.
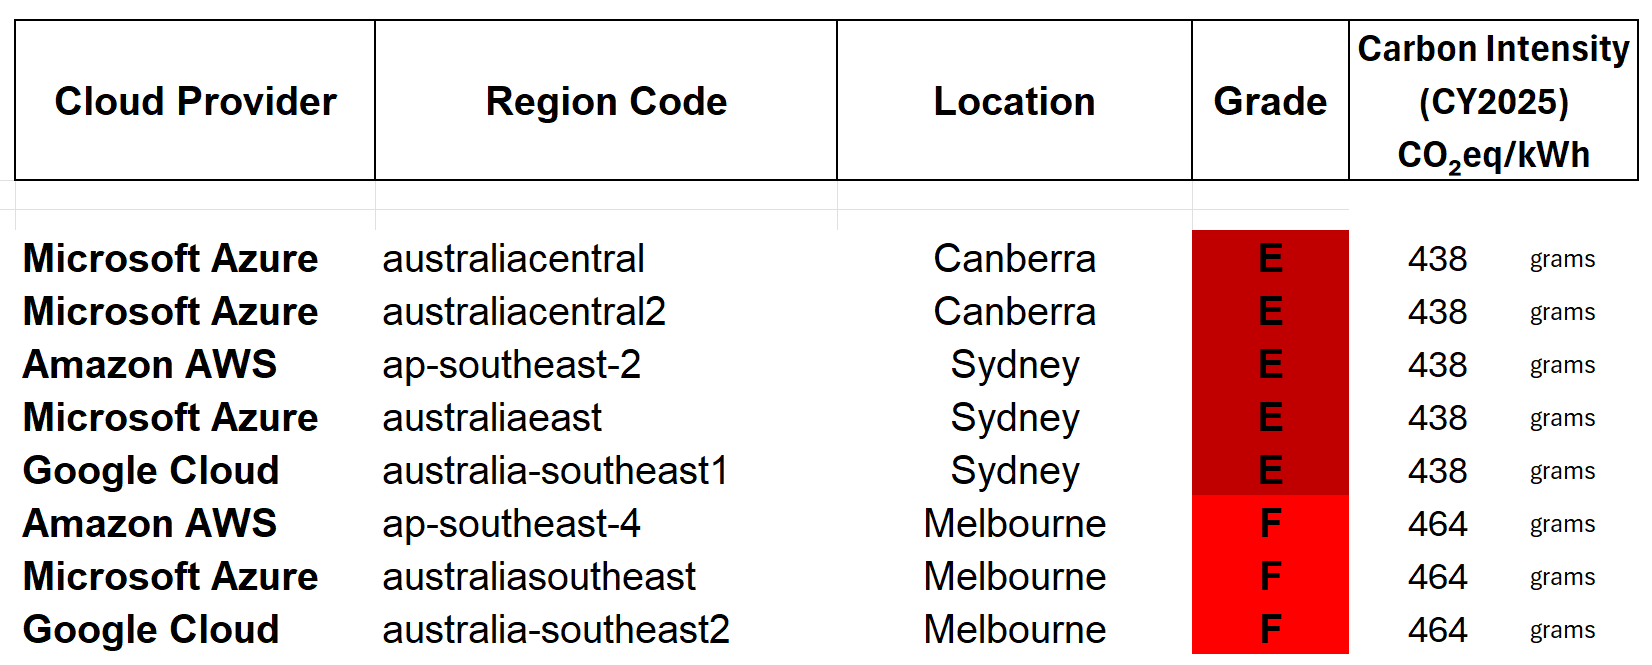
Key Takeaway: Melbourne-based regions (often labeled "Southeast" or "South") are currently grading as F, the worst possible score. Sydney and Canberra perform slightly better but are still stuck at Grade E.
The "New Zealand" Opportunity
For Australian architects bound by latency but not strictly by data residency within Australian borders, the Q1 2026 scorecard highlights a distinct outlier just across the ditch: New Zealand.
Microsoft’s Azure's `newzealandnorth` region scored a Grade B (the best rating in the Asia Pacific region). While not the "A+" seen in Sweden, a "B" grade is roughly **3x to 6x cleaner** than the "E" grade regions in Sydney and Canberra, and vastly superior to the "F" grades in Melbourne.
The GreenOps Move: If your user base is in ANZ and your compliance allows for it, shifting workloads to `newzealandnorth` is the single most impactful architectural decision you can make right now. You get acceptable latency for most applications with a massive reduction in carbon footprint.
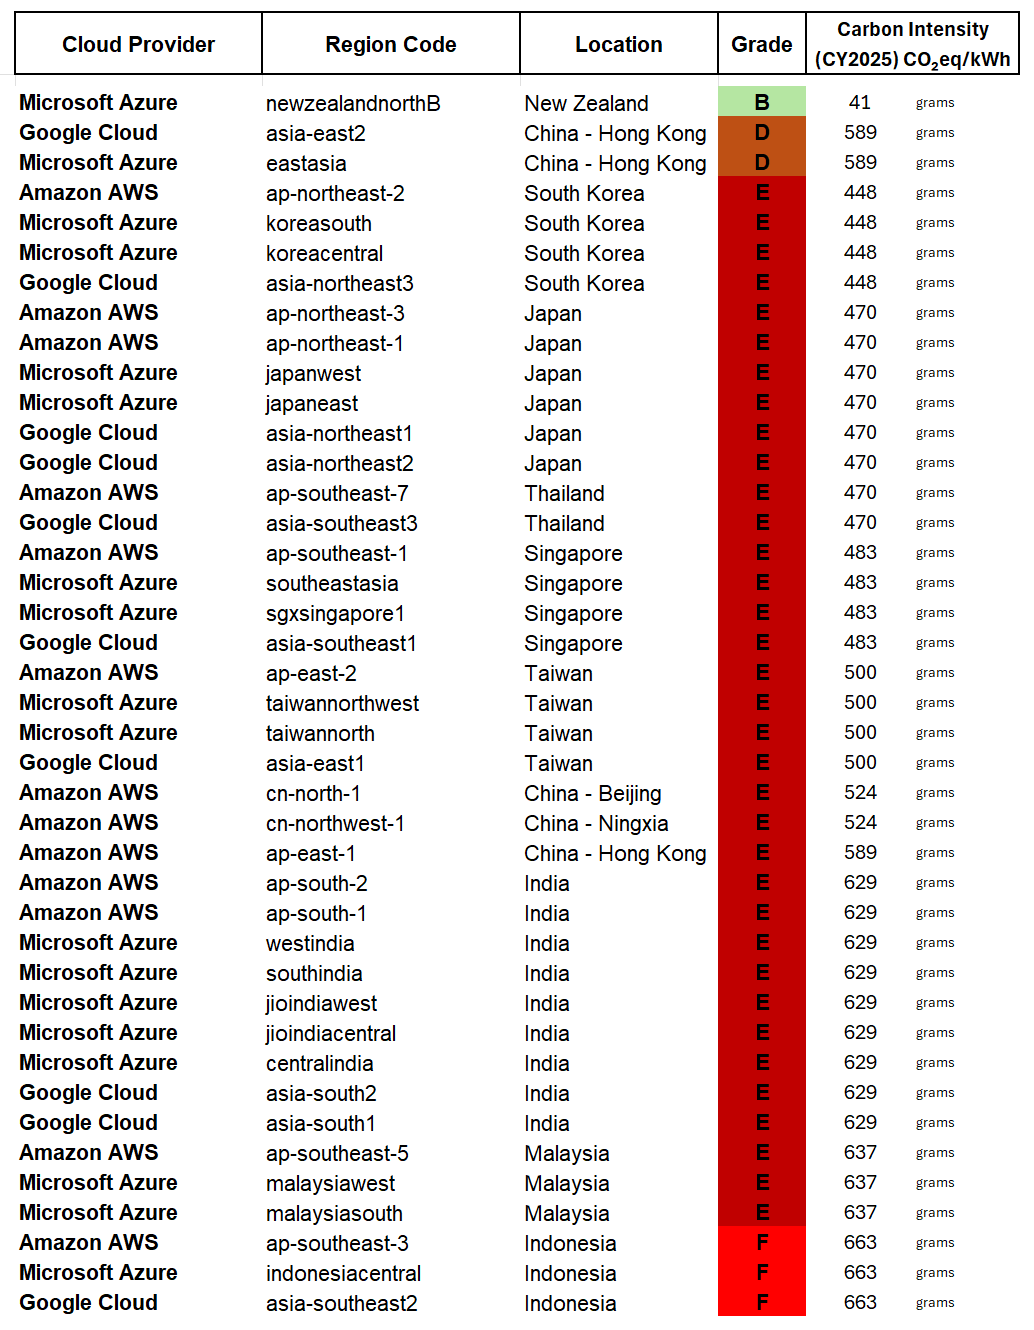
Rest of Asia Pacific Cloud Regions (Non-Australian) Source: Greenpixie Cloud Region Carbon Intensity Scorecard (Jan 2026)
Strategies for Staying Local (When You Must)
We understand that data sovereignty laws often force deployments to stay strictly on Australian soil. If you must deploy in a Grade E (Sydney) or Grade F (Melbourne) region, here is how you can apply GreenOps principles:
Avoid the "F" if Possible: If you have a choice between Sydney (E) and Melbourne (F) for your primary region, Sydney is currently the greener choice based on grid intensity averages.
Maximise Utilisation: Since every kWh in Australia is carbon-heavy, ensure you aren't wasting any. Aggressive rightsizing and autoscaling are mandatory here.
Time-Shifting: Australia has a "duck curve" energy grid—lots of solar during the day, fossil fuel coal/gas at night. Can your batch jobs run during peak solar hours (midday) rather than overnight?
Shift Batch Jobs Globally: If data residency allows, route heavy, non-latency-sensitive batch processing to global regions like `us-west-2` (Grade C) or `eu-north-1` (Grade A+) and bring the results back to Australia.
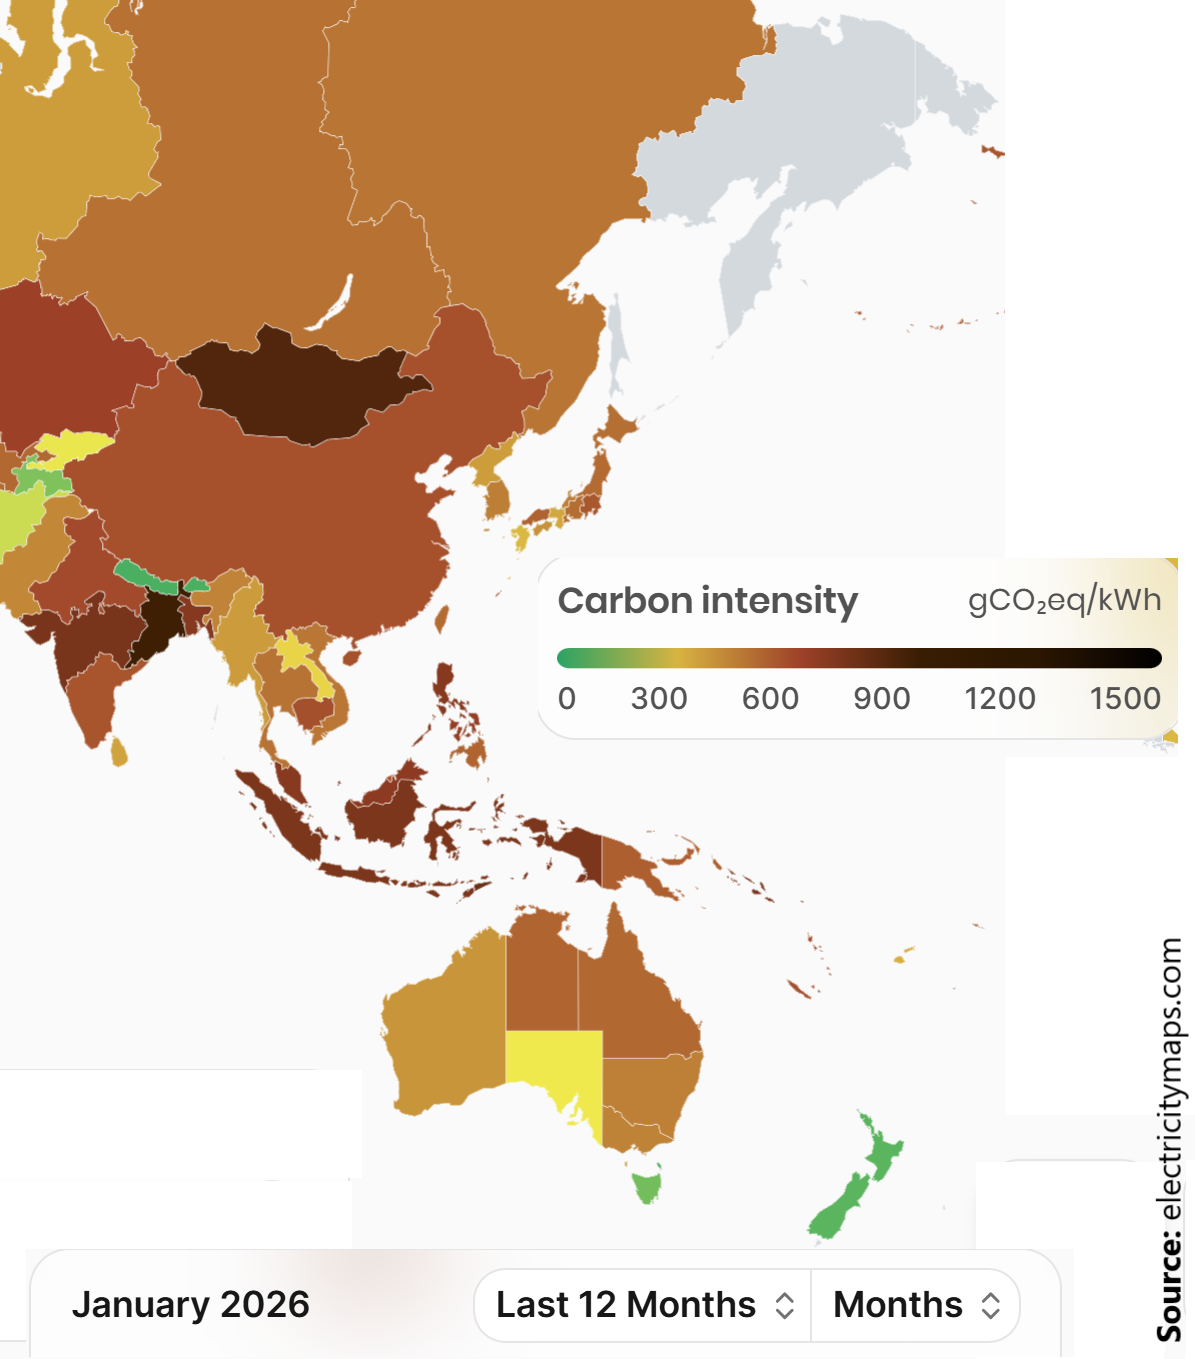
ASIA Pacific 2025 Carbon Intensity (12 Mths)
Shift Left in 2026
The difference between a Grade F region and a Grade A+ region is over 99.5% in Scope 2 emissions.
Remember, the best time to make carbon-aware choices is before you spin up infrastructure when architecture and automation are still flexible.
In 2026, don't just deploy to `ap-southeast-2` out of habit. Check the scorecard. If you are in Australia, consider New Zealand for a quick win, or optimise aggressively to mitigate the impact of our local grid.
References
Data Source: Greenpixie Cloud Region Carbon Intensity Scorecard (January 2026).
Green Web Foundation - an independent non-profit that tracks how much of the internet runs on green energy.
Electricity Maps - The world's most comprehensive electricity data platform
Cloud Provider Region Pickers Google Cloud Microsoft Azure Amazon AWS